The Cup and Handle Pattern
A cup and handle pattern was originally defined by the American entrepreneur William J. O’Neil in his book How To Make Money In Stocks. He later added specific requirements in articles published in Investors Business Daily which he founded. In these articles he included time frames and descriptions of patterns that occur. This guide is intended to sum up a modern version of his observations (BTW, click here for our overview of the basics of technical analysis if you need that first).
The Cup & Handle
Click here to learn something new
Generally, cup and handle patterns can take weeks or months to form, but in these growing ecosystems, I have seen them in smaller time frames. I do assert though that the longer the cup and handle take to form, the more reliable the pattern will be.
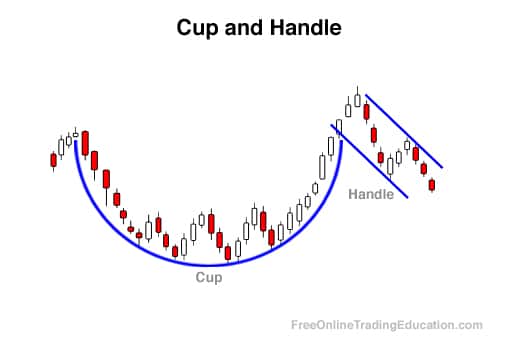
When charted out you can start to see why it was given such a unique name. The pattern occurs when there is a price drop followed by a wave up in price of about equal size to the drop, resulting in the “cup.” Once the cup is completed, a trading range develops on the right side where the price stays consistent or drops slightly over a period of time. This is “handle” of the cup and can be visualized below, and can frequently be charted as a wedge followed by a breakout in price. This breakout is where many traders make their money with the cup and handle pattern.
How To Use The Cup and Handle Pattern
Cup and Handle Pattern Indications
The handle or the right hand side of the handle can often be spotted because of its shape and low trading volume. A general rule is that the handle should not be larger than the cup itself and should not drop lower than the halfway point of the cup, ideally it stays near the top of it. It is important to note that these signals are not cut and dry and every situation is different. The cup and handle pattern is usually an indication of a good buying period during the bullish continuation pattern.
A stop buy order should be placed slightly higher than the upper trend line of the handle. Here are a few more key identifiers for the cup and handle pattern:
Depth - The cup should not be very deep, and it should reach its greatest depth gradually, the handle should, ideally begin at the top of the right side of the cup.
Volume- The volume as mentioned before should reduce as the price decreases and stay below the average at the bottom of the cup. As the price increases back up to the previous high, the volume should also be increasing for best results.
Length- Cups that have longer “U” shaped bottoms are stronger indication than those with sharp “V” shaped bottoms. Try your best to avoid these sharp false signals.
Drawing a Cup and Handle Pattern
Because of its unique shape, the pattern can be hard to draw at times. The easiest way to draw the cup is to use a curved drawing tool, if your trading platform supports it.
To draw the “classic” or bullish pattern, take the top of the cup on the left and right and drag the curved line down to validate the shape of the cup. Using the line tools, correctly identify and draw the handle of the pattern. This is usually a wedge or parallel lines downward.
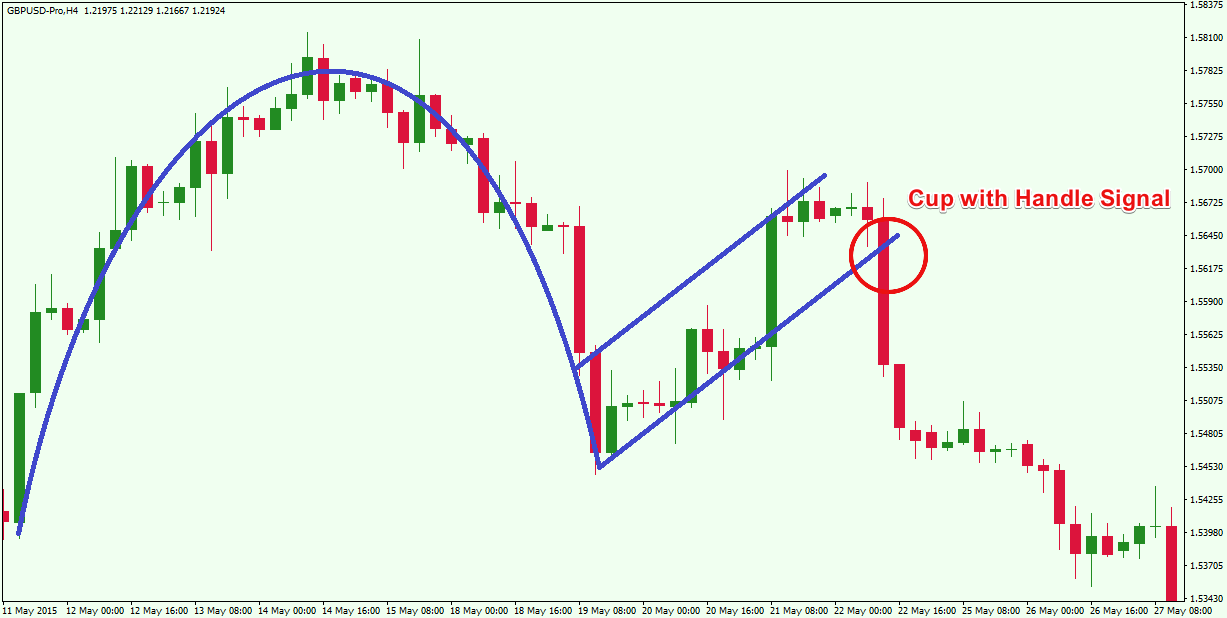
Drawing the bearish version of the pattern is quite similar. In this case take the curved tool and select the two points of the cup and drag the line up to validate a bearish cup. Use the line tool once again to draw the handle, this is usually an ascending wedge or ascending parallel lines.

Entering The Trade
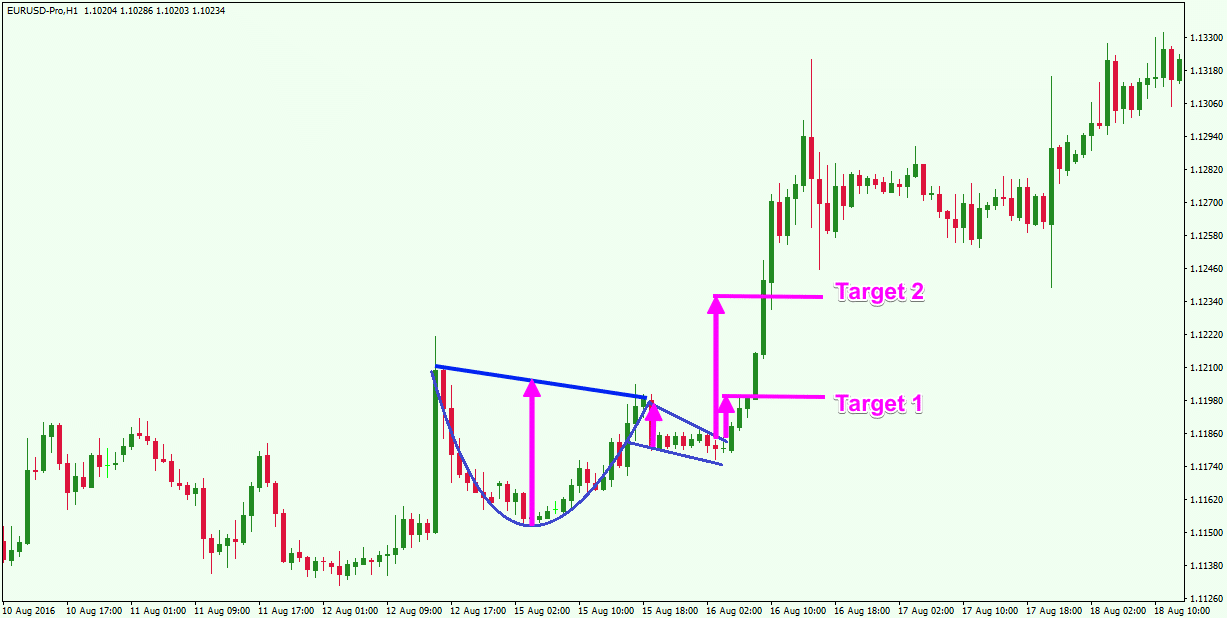
After technically analyzing a potential cup being formed, wait for its handle to form as well. The handle can usually be identified by a descending or level wedge, once the price has broken through this wedge the price can begin to rise, this “breakthrough” is the best time to enter the trade.
If the trendline is increasing and the cup and handle starts at the midpoint of the trend, then the signal to buy is very strong. If you notice this happening keep an eye out for the bottom of the cup to be analogous with long term support levels like the moving average or a rising trend line.
In the event that the cup and handle begins to form after a downtrend, this could be a strong indication that the trend could start to reverse. To have stronger validation of this look out for the waves in the downtrend get smaller heading into the cup and handle pattern, this is a good sign that selling is slowing down. This increases the probability of an upward trend if the price breaks through.
Using a Stop-Loss
Although the pattern predicts that the price will continue to rise, it is possible that the price can drop. That is why it is important to implement a Stop-Loss to minimize losses. Don’t let your emotions trade for you, use a strategy and stick to it. It is always better to take small losses then it is to lose large amounts of your hard earned money.
The ideal place to insert your stop-loss is at the lowest point of the handle, or you the trader should choose a percentage that you are willing to lose. As mentioned before the handle must occur in the top of the cup, stop-losses should not fall below the halfway point of the cup formation. If you find yourself in a situation where the stop-loss is below the mid-way point of the cup, then it is highly suggested that you avoid this trade and look for better entry points in the future.
Keeping stop-losses tight and taking profits when they occur is a very conservative and smart way to trade. In the end it all depends on what you are willing to lose. Using a trailing stop-loss can be used to exit positions that move close to your target but then begin to drop again.
Exiting The Trade
On the other hand, having a smart and thought out exit point is just as important as a proper stop-loss. A general rule of thumb is to add the height of the cup to the breakout point, where this lands is a great area to consider taking profits. There are many instances where the two sides of the cup are not the same height, when this occurs it is smart to use the smaller height of the cup to calculate exit points. The reasoning behind using the smaller side is that it is a much more reasonable goal, but in the end choosing an exit is up to the trader.
Many traders will gradually sell off their profits throughout the breakout, just in case the price continues to rise. This strategy is best if you truly believe that the price will keep rising and you don't want to miss out on potentially large profits. If you are looking for good positions to sell consider using the Fibonacci Extension from the bottom of the cup to the high on the right side, then pull it down to the handle low. These levels represent potential sell points, for more information on how to use the Fibonacci Tool go check out our step by step guide for the best results!
If you are day trading and the target price you wished to reach wasn't hit, make sure you close your position before the end of the trading day. This does not apply when trading cryptocurrencies because the markets are open 24/7 and it is a big reason that we choose to trade them over market trading.
Variations of The Cup and Handle Pattern
Having a general grasp of the classic cup and handle pattern is great for beginner and intermediate traders looking to add some knowledge to their “trading tool belt.” But like most things in life there are a few other variations of this pattern that can also be implemented to increase profit margins. It's important to know that every situation will be unique and will need to be approached with a slightly different strategy. Experienced traders know how to adapt on the fly and integrate their knowledge to increase their odds of coming out on top.
Bullish Cup and Handle
This version of the cup and handle is the most well known and the one we have been discussing throughout this analysis. When the pattern is confirmed the price is likely to rise and make a bullish move. This bullish area is where the profits are made. This pattern is the easiest and most used variation of the pattern to execute.

Bearish Cup and Handle
This version of the pattern starts with a bullish run and retraces itself with a bearish run that turns into the handle. The handle in this pattern is usually an ascending wedge. Once this wedge is broken through the bottom a price drop is likely to occur. This version of the pattern is quite literally the opposite of the classic cup and handle. It is important to be able to identify both of these patterns.

Cup and Handle Conclusion
Although the cup and handle pattern can indicate very strong buy periods, to get the best and most accurate information other indicators should be used to maximize profits. You can learn more about these tools in our Academy. One of the main things to be aware of when using this pattern is the time frames in which they occur on, if you are trading Bitcoin or other cryptocurrencies these cup and handles may form within a matter of hours and you need to be ready for when they happen. When you are trading anything other than cryptos these time frames tend to take much longer, the average cup and handle pattern usually occurs over a month or two.
You need to be ready and educated to make the correct move on these patterns. The best way to prepare yourself is to practice. Like any other pattern , the cup and handle may throw some false signals and end up pulling back. For this reason, as mentioned before, always use calculated stop losses! This is not the only trading technique and it is highly recommended to use various techniques to be a well rounded trader. This space will eat you up if you are a one trick pony.
We hope you enjoyed this analysis of the well known cup and handle pattern. If you have any questions or concerns feel free to leave a comment down below or contact us. Head over to the homepage for more trading techniques and cryptocurrency topics. We are here to help and educate, have a great day!

